Sabtu, 30 September 2023
Hirarki Klasifikasi Single Linkage Menggunakan Minkowsky Distance

- D1,D1 artinya (X1-X1) + (Y1-Y1) ^ 1/C1 (menggunakan jarak minkowsky)
- D1,D2 artinya (X1-X2) + (Y1-Y2) ^ 1/C1 (menggunakan jarak minkowsky)
- D1,D3 artinya (X1-X3) + (Y1-Y3) ^ 1/C1 (menggunakan jarak minkowsky)
- D1,D4 artinya (X1-X4) + (Y1-Y4) ^ 1/C1 (menggunakan jarak minkowsky)
- D1,D5 artinya (X1-X5) + (Y1-Y5) ^ 1/C1 (menggunakan jarak minkowsky)
- D2,D2 artinya (X2-X2) + (Y2-Y2) ^ 1/C1 (menggunakan jarak minkowsky)
- D2,D3 artinya (X2-X3) + (Y2-Y3) ^ 1/C1 (menggunakan jarak minkowsky)
- D2,D4 artinya (X2-X4) + (Y2-Y4) ^ 1/C1 (menggunakan jarak minkowsky)
- D2,D5 artinya (X2-X5) + (Y2-Y5) ^ 1/C1 (menggunakan jarak minkowsky)
- D3,D3 artinya (X3-X3) + (Y3-Y3) ^ 1/C1 (menggunakan jarak minkowsky)
- D3,D4 artinya (X4-X4) + (Y4-Y4) ^ 1/C1 (menggunakan jarak minkowsky)
- D3,D5 artinya (X5-X5) + (Y5-Y5) ^ 1/C1 (menggunakan jarak minkowsky)
- D4,D4 artinya (X4-X4) + (Y4-Y4) ^ 1/C1 (menggunakan jarak minkowsky)
- D4,D5 artinya (X4-X5) + (Y4-Y5) ^ 1/C1 (menggunakan jarak minkowsky)
- D5,D5 artinya (X5-X5) + (Y5-Y5) ^ 1/C1 (menggunakan jarak minkowsky)
- D1,D1

- D1,D2
- D1,D3
- Lakukan perhitungan hingga D5,D5


- D(12)3
- D(12)4
- D(12)5


Setelah itu dipilih lagi data yang terkecil dari data
diatas, sehingga yang didapat adalah sebagai berikut :
- D(123)4
- D(123)5
Hasil yang di dapat adalah sebagai berikut :
Setelah di dapatkan datanya, maka di pilih nilai terkecil sehingga membentuk matrik sebagai berikut :

Setelah itu dipilih lagi data yang terkecil dari data diatas, sehingga yang didapat adalah sebagai berikut :
- D(1234)5
Hasil yang di dapat adalah sebagai berikut :


Kamis, 28 September 2023
Konversi Biner ke Oktal
Untuk
melakukan konversi biner ke oktal lakukan bagi setiap 3 digit menjadi sebuah
angka oktal dimulai dari paling kanan.
Contoh
:
101102 = ............ 8 ?
- Pertama-tama bagi menjadi kelompok yang terdiri dari 3 digit biner: 10 dan 110.
- Kemudian konversi setiap kelompok dengan menggunakan perhitungan konversi biner ke desimal.
- Sehingga didapat 101102 = 268
Selasa, 26 September 2023
Single Linkage Classification Hierarchy Using Manhattan Distance
- D1,D1 means (X1-X1) + (Y1-Y1) (using manhattan distance)
- D1,D2 means (X1-X2) + (Y1-Y2) (using manhattan distance)
- D1,D3 means (X1-X3) + (Y1-Y3) (using manhattan distance)
- D1,D4 means (X1-X4) + (Y1-Y4) (using manhattan distance)
- D1,D5 means (X1-X5) + (Y1-Y5) (using manhattan distance)
- D2,D2 means (X2-X2) + (Y2-Y2) (using manhattan distance)
- D2,D3 means (X2-X3) + (Y2-Y3) (using manhattan distance)
- D2,D4 means (X2-X4) + (Y2-Y4) (using manhattan distance)
- D2,D5 means (X2-X5) + (Y2-Y5) (using manhattan distance)
- D3,D3 means (X3-X3) + (Y3-Y3) (using manhattan distance)
- D3,D4 means (X4-X4) + (Y4-Y4) (using manhattan distance)
- D3,D5 means (X5-X5) + (Y5-Y5) (using manhattan distance)
- D4,D4 means (X4-X4) + (Y4-Y4) (using manhattan distance)
- D4,D5 means (X4-X5) + (Y4-Y5) (using manhattan distance)
- D5,D5 means (X5-X5) + (Y5-Y5) (using manhattan distance)
- D1,D1

- D1,D2

- D1,D3

- Perform calculations up to D5,D5


- D(45)1
- D(45)2
- D(45)3


- D(452)1
- D(452)3


Minggu, 24 September 2023
Convert Binary to Decimal
Example :
101102 = …….10 ?
101102 = + 1×24 + 0x23 +
1×22 + 1×21 + 0x20 = 16 + 0 + 4 + 2 + 0 = 2210
Jumat, 22 September 2023
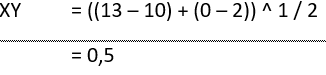
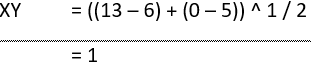
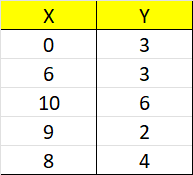
Single Linkage Classification Hierarchy Using Euclidean Distance

- D1,D1 means (X1-X1) + (Y1-Y1) (using euclidean distance)
- D1,D2 means (X1-X2) + (Y1-Y2) (using euclidean distance)
- D1,D3 means (X1-X3) + (Y1-Y3) (using euclidean distance)
- D1,D4 means (X1-X4) + (Y1-Y4) (using euclidean distance)
- D1,D5 means (X1-X5) + (Y1-Y5) (using euclidean distance)
- D2,D2 means (X2-X2) + (Y2-Y2) (using euclidean distance)
- D2,D3 means (X2-X3) + (Y2-Y3) (using euclidean distance)
- D2,D4 means (X2-X4) + (Y2-Y4) (using euclidean distance)
- D2,D5 means (X2-X5) + (Y2-Y5) (using euclidean distance)
- D3,D3 means (X3-X3) + (Y3-Y3) (using euclidean distance)
- D3,D4 means (X4-X4) + (Y4-Y4) (using euclidean distance)
- D3,D5 means (X5-X5) + (Y5-Y5) (using euclidean distance)
- D4,D4 means (X4-X4) + (Y4-Y4) (using euclidean distance)
- D4,D5 means (X4-X5) + (Y4-Y5) (using euclidean distance)
- D5,D5 means (X5-X5) + (Y5-Y5) (using euclidean distance)
- D1,D1

- D1,D2
- D1,D3
- Perform calculations up to D5,D5


- D(35)1
- D(35)2
- D(35)4


- D(352)1
- D(352)4

- D(3521)4


Rabu, 20 September 2023
Konversi Biner ke Desimal
Untuk melakukan konversi dari bilangan biner atau bilangan
berbasis selain 10 ke bilangan berbasis 10 (desimal) maka anda tinggal
mengalikan setiap digit dari bilangan tersebut dengan pangkat 0, 1, 2, …,
dst, dari basis mulai dari yang paling kanan.
Contoh :
101102 = …….10 ?
101102 = + 1×24 + 0x23 +
1×22 + 1×21 + 0x20 = 16 + 0 + 4 + 2 + 0 = 2210
Sabtu, 16 September 2023
Naive Bayes Classification Calculations (Part 3) Test Data Test Phase
- Driver = Sick
- Lights = On
- Tires = Enough
- Machine = Old
- Description = ?

Kamis, 14 September 2023
Convert Decimal to Hexadecimal
As with binary and octal, we will use the same calculation technique.
Example 1:
6710 = …….16 ?
- First of all 67/16 = 4, remainder 3
- Then 4/16 = 0, remainder 4,
- Thus from the calculation results obtained 6710 = 4316
Example 2:
9210 = ………………………16 ?
- First 92/16 = 5, remainder 12 (written C)
- Then 5/16 = 0, remainder 5,
- Thus from the calculation results obtained 9210 = 5C16
Selasa, 12 September 2023
Senin, 11 September 2023
Calculation of Naive Bayes Classification (Part 2) Training Data Test Phase
- Training Data Test Phase

- The data above is the data that we have obtained from the previous training data
- What is calculated first is the part of P (Remarks | Roadworthy)
- P(Remarks|Easy to Road) is the calculation for the criteria Description|Easy to Go * Driver criteria = Healthy * Lights criteria = On * Tire criteria = New * Machine criteria = New
- = 0.6 * (0.555556 * 0.666667 * 0.555556 * 0.44444) and the result is below
- This stage is carried out for all training data


- The data that corresponds to the training data is 13 data
- Data that does not match the training data are 2 data
Sabtu, 09 September 2023
Konversi Desimal ke Heksadesimal
Seperti halnya biner dan oktal, kita pun akan menggunakan teknik perhitungan yang sama.
Contoh 1:
6710 = …….16 ?
- Pertama-tama 67/16 = 4, sisa 3
- Lalu 4/16 = 0, sisa 4,
- Dengan demikian dari hasil perhitungan didapatkan 6710 = 4316
Contoh 2:
9210 = ………………………16 ?
- Pertama-tama 92/16 = 5, sisa 12 (ditulis C)
- Lalu 5/16 = 0, sisa 5,
- Dengan demikian dari hasil perhitungan didapatkan 9210 = 5C16
Kamis, 07 September 2023
Naive Bayes Classification Calculations (Part 1)
In this post, I will discuss classification calculations using the Naive Bayes method.
What we will classify is the Roadworthy BUS Classification
The data to be used consists of the following:
- Number of data = 14
- Noise = 4
- Number of classifications = 2

- Roadworthy = 9/15 = 0.6
- Not Roadworthy = 6/15 = 0.4
- 15 is the amount of data
- 9 is the amount of data for Roadworthy
- 6 is the amount of data for Not Roadworthy
- Roadworthy Category

- P(Driver=Healthy|Road Worthy) is the number of Healthy and Roadworthy Driver categories
- 5 is the number of healthy drivers who are roadworthy
- 9 is the number of roadworthy classifications
- So the result is 0.555556
- Likewise with the next process
- Not Roadworthy Category

- P(Driver=Healthy|Unfit for Road) is the number of categories of Healthy and Unfit for Road drivers
- 2 is the number of healthy drivers who are not roadworthy
- 6 is the number of classifications not roadworthy
- So the result is 0.333333
- Likewise with the next process

-
Data Sets (Calculating Distances With Euclidean ) Using Excel How to calculate the distance with Euclidean using Excel is as follows: The...
-
Contoh Metode Tsukamoto Pernyataan Sebuah perusahaan makanan kaleng akan memproduksi makanan jenis ABC. Dari data 1 bulan terakhir, permin...
-
# GUI -> Graphical User Interface import tkinter as tk #konstruktor untuk membuat jendela utama GUI from tkinter import t...

