The classification hierarchy will use Manhattan distances.
The data we will use is as follows :
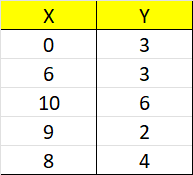
The initial stage is to calculate between X data and Y data.
At this stage, the method of calculation is different from the others.
The calculation stage is as follows :
- D1,D1 means (X1-X1) + (Y1-Y1) (using manhattan distance)
- D1,D2 means (X1-X2) + (Y1-Y2) (using manhattan distance)
- D1,D3 means (X1-X3) + (Y1-Y3) (using manhattan distance)
- D1,D4 means (X1-X4) + (Y1-Y4) (using manhattan distance)
- D1,D5 means (X1-X5) + (Y1-Y5) (using manhattan distance)
- D2,D2 means (X2-X2) + (Y2-Y2) (using manhattan distance)
- D2,D3 means (X2-X3) + (Y2-Y3) (using manhattan distance)
- D2,D4 means (X2-X4) + (Y2-Y4) (using manhattan distance)
- D2,D5 means (X2-X5) + (Y2-Y5) (using manhattan distance)
- D3,D3 means (X3-X3) + (Y3-Y3) (using manhattan distance)
- D3,D4 means (X4-X4) + (Y4-Y4) (using manhattan distance)
- D3,D5 means (X5-X5) + (Y5-Y5) (using manhattan distance)
- D4,D4 means (X4-X4) + (Y4-Y4) (using manhattan distance)
- D4,D5 means (X4-X5) + (Y4-Y5) (using manhattan distance)
- D5,D5 means (X5-X5) + (Y5-Y5) (using manhattan distance)
Then the calculation is:
- D1,D1

- D1,D2

- D1,D3

- Perform calculations up to D5,D5
Note that for Manhattan the final value is the absolute value
So the following results are obtained :

Next is to create a matrix diagram :

From the matrix above, we will choose the smallest result except 0 and it turns out that the smallest value is 1 which is owned by data 4 to 5 and 5 to 4.
We will combine the data to form the following :
- D(45)1
- D(45)2
- D(45)3
The results obtained are as follows :

After getting the data, the smallest value is selected so that it forms the following matrix :

After that, the smallest data is selected from the data above, so that what is obtained is as follows:
- D(452)1
- D(452)3
The results obtained are as follows :

After getting the data, the smallest value is selected so that it forms the following matrix :

After that, the smallest data is selected from the data above, so that what is obtained is as follows :
D(4523)1
The results obtained are as follows :
After getting the data, the smallest value is selected so that it forms the following matrix :

From the results above, we can make a diagram, so the diagram that is formed is as follows :


Tidak ada komentar:
Posting Komentar